1 The Data
Each dot represents a California county. Counties with CHW programs tend to have better diabetes control rates. Is this evidence that CHW programs work? (Data are simulated for illustration.)
Community Resources vs Diabetes Control
2 The Problem
Counties with CHW programs also tend to be wealthier with more healthcare resources. That's not a coincidence—it takes resources to fund CHW programs. But those same resources also improve health outcomes directly.
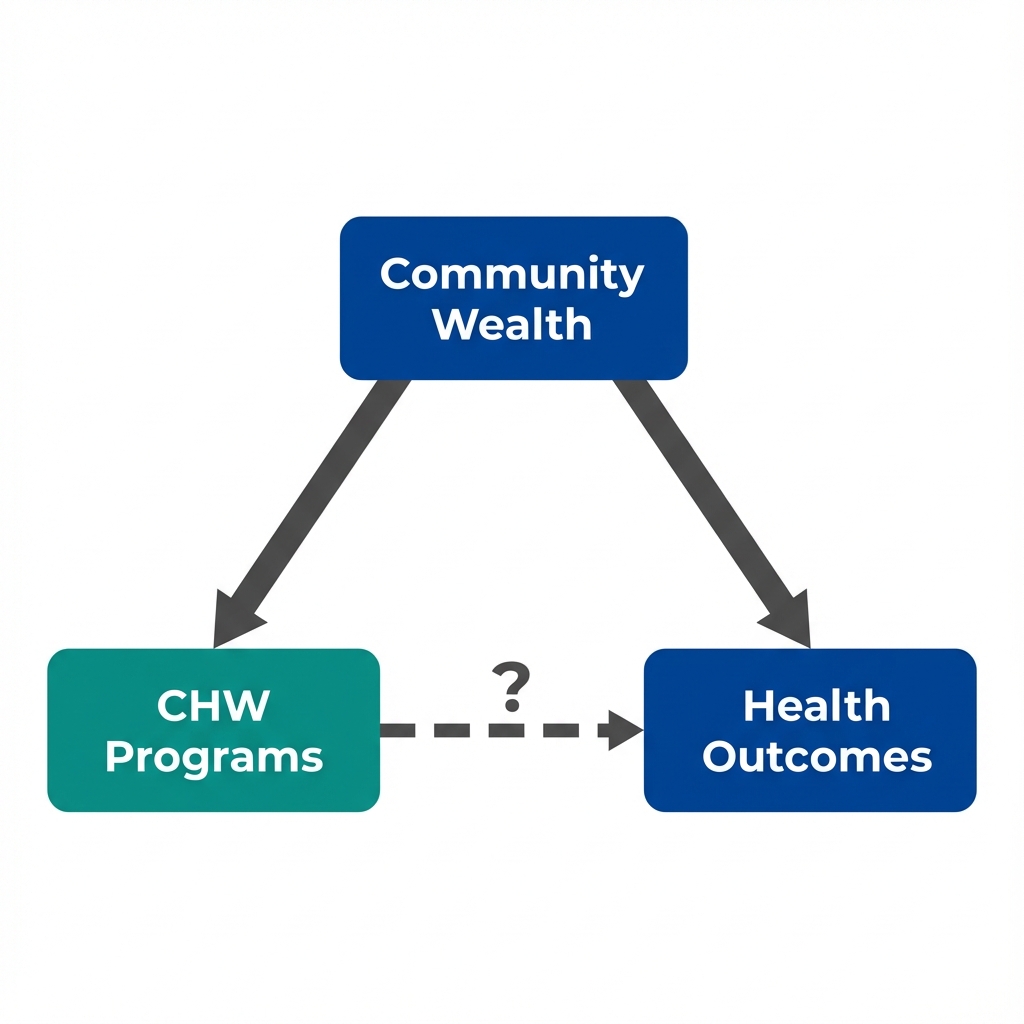
Arrows show potential causal relationships. The dashed arrow is what we want to know about.
3 Seeing the Confounder
If community resources drive both CHW presence and health outcomes, then comparing counties within the same resource level should show a smaller CHW advantage. Use the filters below to stratify the data.
The effect shrinks when we account for Community Resources.
But what about factors we couldn't measure?
4 What We Can't Measure
Stratification helped with what we measured. But some factors that influence both CHW presence and health outcomes don't appear in any dataset.
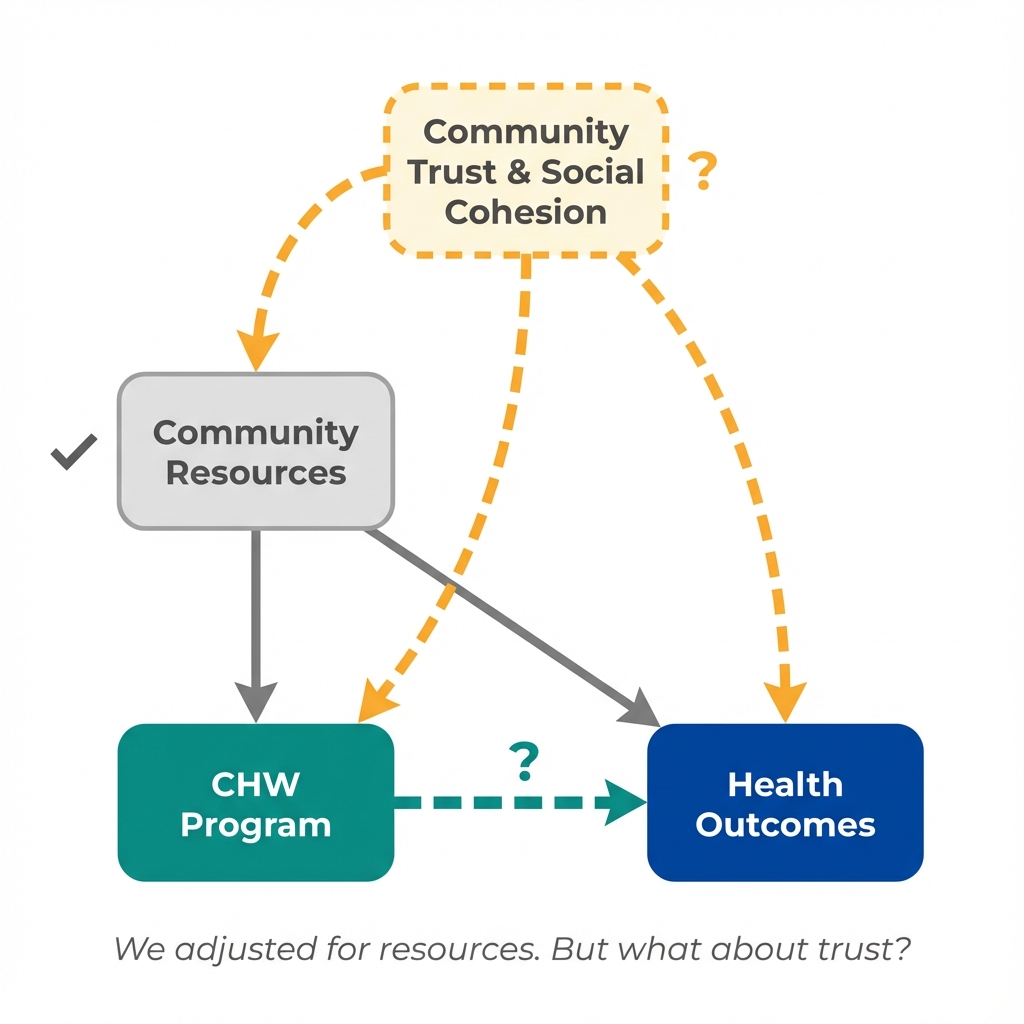
Community Trust & Social Cohesion
Counties with strong social bonds might both embrace CHW programs more readily AND see better health outcomes through informal support networks.
This isn't in any dataset. We can't stratify by it. We can't adjust for it. Yet it could be driving both the "treatment" and the "outcome."
This is the problem of unmeasured confounding. No matter how carefully we adjust for what we can see, there may be hidden factors we can't account for.
5 Questions to Consider
These questions help identify confounding threats that statistical adjustment cannot fix. They won't prove causation—but they'll reveal where the analysis is most vulnerable to bias.
What else differs between these counties?
Counties with CHW programs might differ from other counties in many ways beyond just having CHWs.
Is this a fair comparison?
Cross-sectional data shows us a snapshot, not a story. We're comparing different counties at one point in time.
Which came first?
In this data, we see outcomes and CHW presence at the same time. We don't know the sequence.
What study design would help?
This observational data has limitations. A different approach might give stronger evidence.
Concepts Demonstrated in This Lab
Key Takeaway
No amount of statistical adjustment can fix a flawed comparison. When unmeasured factors drive both treatment and outcomes, the solution isn't better adjustment—it's finding sources of treatment variation that operate independently of unmeasured confounders. Policy changes, eligibility cutoffs, and timing differences can provide this. This is what economists mean by "identification."